
Today, companies rely on mobile apps to provide top-tier service to their customers. Speed is a critical factor for these apps. If you’re aiming for a successful career in software testing, mastering Mobile Performance Testing is a must.
In this article, we’ll cover:
- Why Mobile Performance Testing matters for end users.
- Memory Profiling in Android Studio and XCode Instruments.
- Measuring the “Cold Start.”
- Key Metrics for Mobile Performance Measurement.
- Best Practices for Mobile Performance Testing.
Let’s dive right into it!
The User’s Perspective: Why Mobile Performance Matters
From the user’s point of view, mobile performance is everything. When they tap an app’s icon, they expect it to open swiftly. They anticipate a smooth and responsive experience as they navigate through the app. They take fast load times for granted and notice only when things go awry.

Here’s why mobile performance matters to users:
First Impressions Count: When users download a new app, their initial experience sets the tone for their overall impression. A slow and clunky start can lead to instant frustration, making them less likely to return.
Patience Wears Thin: In today’s fast-paced world, patience is in short supply. Users don’t have time to wait for apps to load or respond slowly to their inputs.
Smooth Navigation: Users expect apps to respond to their gestures and taps immediately. Laggy responses can lead to errors and frustration.
Battery Drain: Inefficient apps that consume excessive resources also drain the user’s device battery faster, leading to dissatisfaction.
Brand Perception: A poor app experience can reflect negatively on the brand. Users may associate performance issues with a lack of care and professionalism.
Retention and Loyalty: Users are more likely to return to and remain loyal to apps that consistently provide a smooth and fast experience.
In essence, mobile performance is the unsung hero of user satisfaction. Users might not think about it consciously, but it’s the element that can make or break their relationship with an app. This is why mobile performance testing is crucial—it ensures that the user experience meets and exceeds expectations.
Performance Bugs: The Hidden Adversaries
Imagine this scenario: You’re a user, eager to explore your favorite mobile app. Your excitement quickly turns to frustration as the app grinds to a halt, taking forever to load or, worse, crashing unexpectedly. You’re not alone; such experiences often lead to a flood of negative user reviews that can send shockwaves through a company. The app’s feedback section becomes a battlefield of complaints, deterring potential customers and casting a shadow over the company’s reputation.

But fear not! Mobile performance testing is the unsung hero, ensuring that apps load quickly, respond smoothly, and operate without a glitch. By identifying and eradicating performance bugs, this testing process protects the user experience and upholds the company’s reputation.
Memory Profiling in Android Studio and XCode Instruments
Enter the world of memory profiling—a powerful tool in the mobile performance tester’s toolkit. It allows testers to peer into how an app consumes memory resources. In Android Studio and XCode Instruments, testers wield memory profiling to uncover memory leaks, inefficient memory usage, and other culprits that can hamper app performance.
Android Studio introduces the Memory Profiler, a magical tool for Android app testing. It tracks and dissects memory usage, helping identify leaks and optimize memory allocation. It’s the guardian angel that ensures your app runs smoothly, even on devices with limited memory.
The same is available for iOS devices. XCode Instruments, the virtuoso of iOS app testing, offers a rich assortment of instruments. Allocations, Leaks, and Activity Monitor are just a few of the maestros in this orchestra. These tools serenade testers with the melodies of memory usage analysis, leak detection, and performance optimization.
Here’s an overview of memory profiling in both development environments:
Memory Profiling in Android Studio:
Heap Dump Analysis: Android Studio provides a Heap Dump feature that captures the memory usage of your app at a specific point in time. This snapshot can be analyzed to identify memory leaks, inefficient memory allocation, and objects consuming excessive memory.
Allocation Tracker: The Allocation Tracker tool in Android Studio records memory allocations and deallocations, helping you pinpoint where and when objects are created and released. This information is valuable for optimizing memory usage.
Memory Monitor: The Memory Monitor tool offers real-time insights into memory consumption. It displays a graph of memory allocation and allows you to observe memory usage trends and anomalies as your app runs.
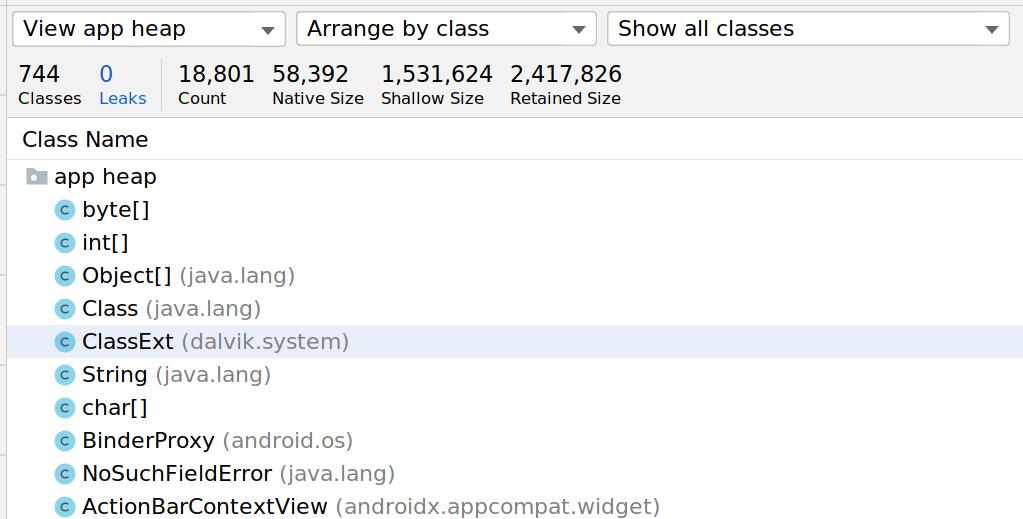
Memory Heap Analysis: Android Studio provides a Memory Heap tab for detailed memory analysis, showing the memory allocation of specific object instances. This helps you understand memory usage patterns and identify potential issues.
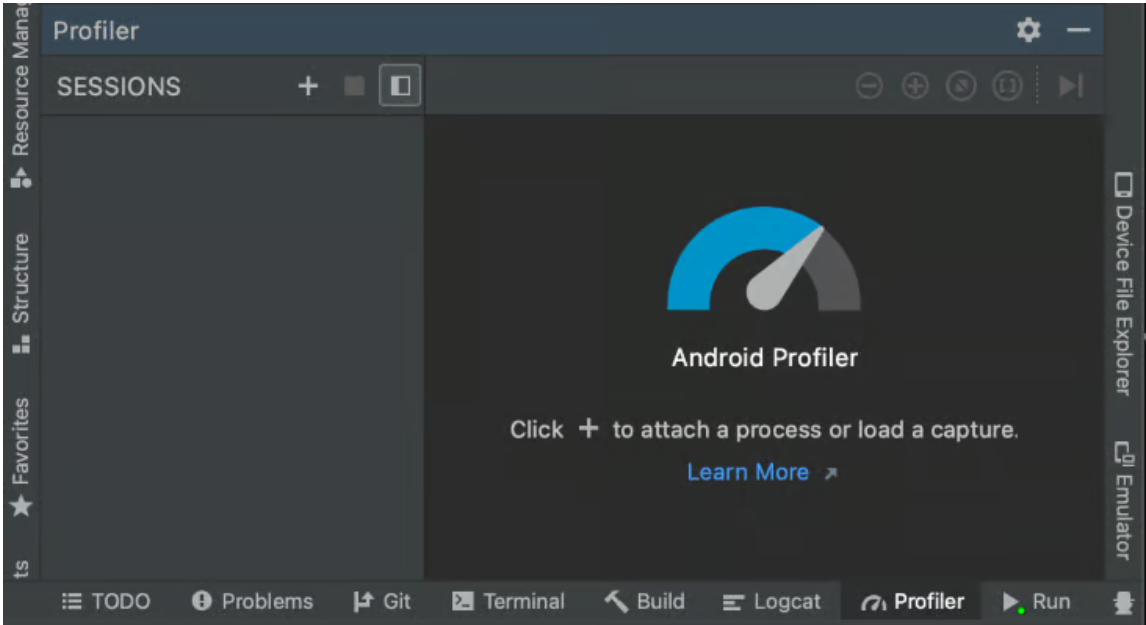
Profiling with Profiler: Android Profiler combines various profiling tools, including memory profiling, into one interface. It offers a comprehensive view of app performance, including CPU, memory, and network usage.
Memory Profiling in XCode Instruments:
Allocations Instrument: The Allocations instrument in XCode Instruments helps track memory allocation and deallocation in your iOS app. It provides information on memory usage, object creation, and memory leaks.
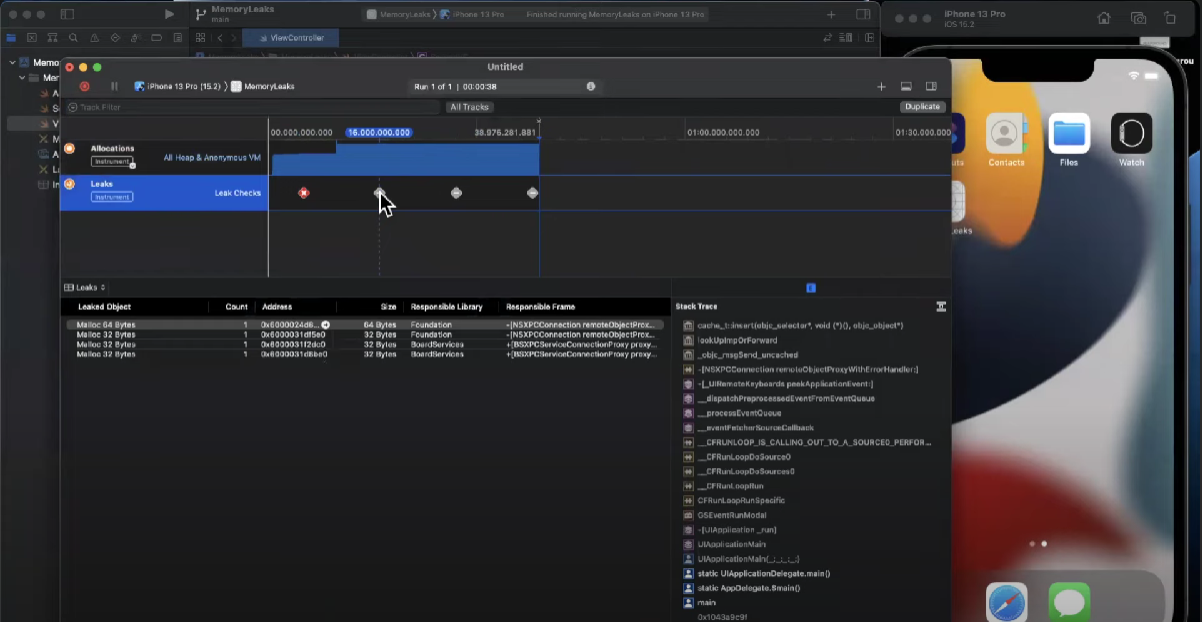
Leaks Instrument: The Leaks instrument is specifically designed to identify memory leaks. It monitors objects that are not properly deallocated, making it easier to locate and address memory-related issues.
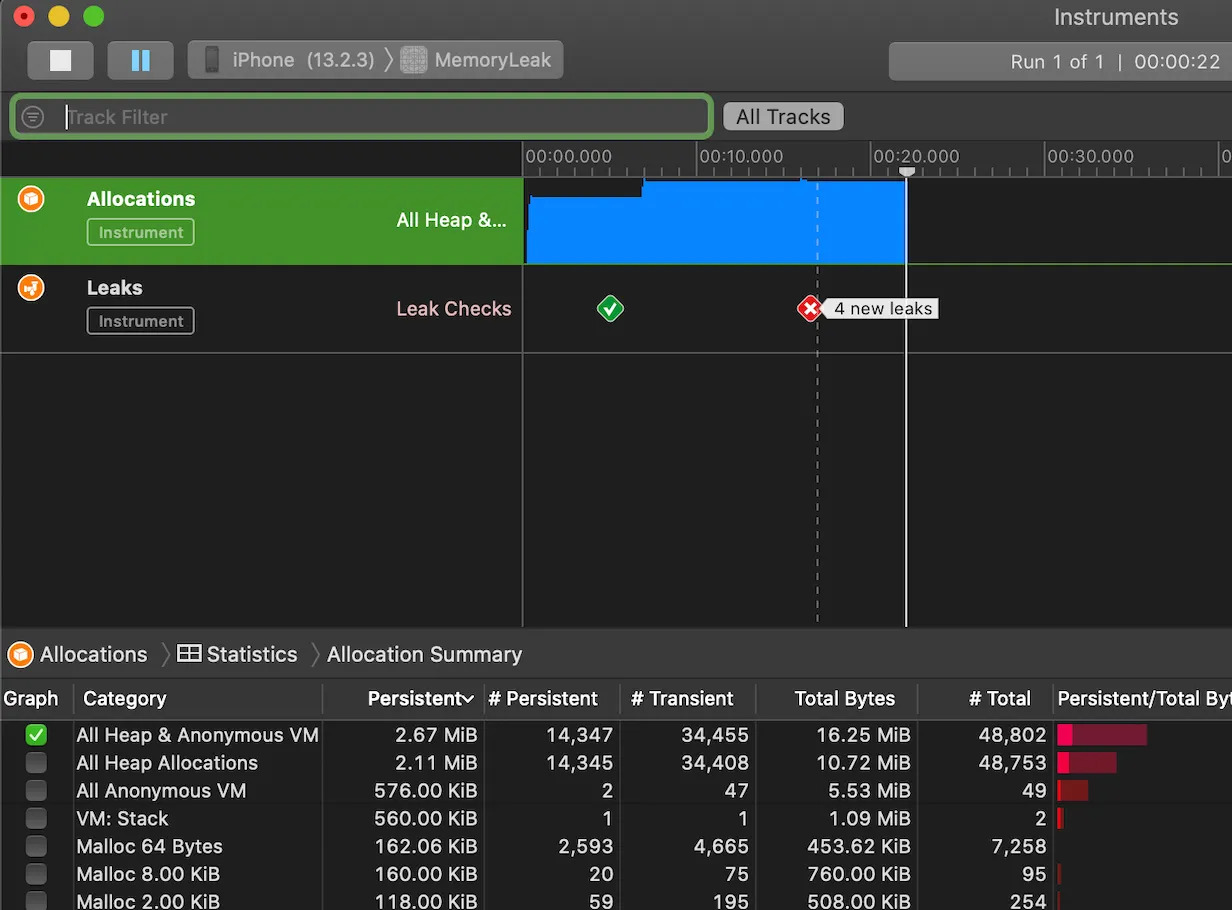
Heapshot Analysis: Heapshot analysis in XCode Instruments captures snapshots of memory allocations over time, allowing you to compare heapshots and find memory growth patterns, which can be indicators of memory issues.
Statistics and Call Trees: XCode Instruments offers detailed statistics about memory usage, including object counts and sizes. Call trees show memory allocations and deallocations within your app, helping you understand the code paths contributing to memory problems.
Profiler Integration: Xcode Instruments can integrate with the XCode Profiler, offering a holistic view of your app’s performance, including memory usage, CPU, and network activity.
Both Android Studio and Xcode Instruments provide powerful tools for memory profiling, enabling developers to identify and resolve memory-related issues such as leaks, inefficient memory usage, and performance bottlenecks, ultimately leading to more efficient and responsive mobile apps.
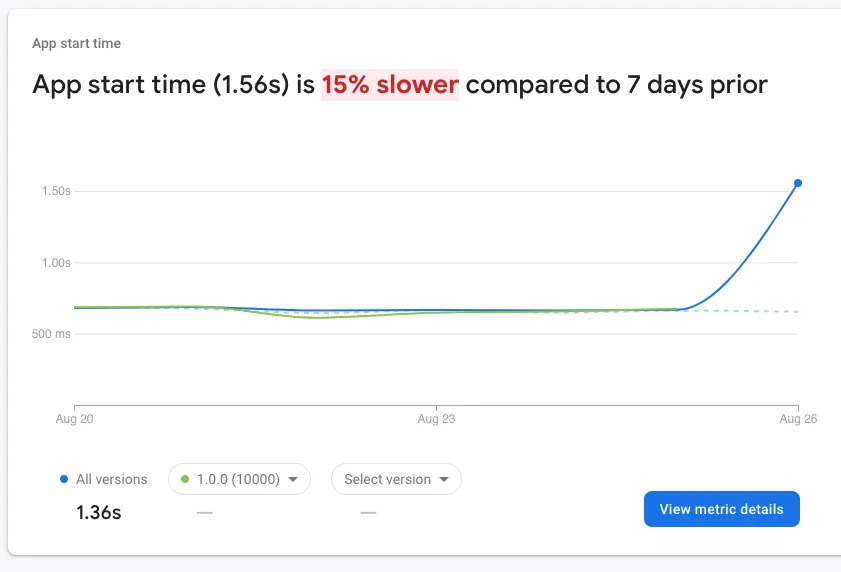
Measuring the “Cold Start”
Now, let’s demystify the enigmatic “Cold start.” It’s the pivotal moment when an app awakens from its slumber. The clock is ticking, as this initial load time shapes the user’s first impression. If an app lags during the cold start, users may grow impatient, potentially leading to a disaster.
To measure Cold Start in app testing, follow these steps:
1. Preparation:
Ensure that the mobile device or emulator is in a state where the app is not running or cached in memory. This can involve rebooting the device or emulator to simulate a fresh start.
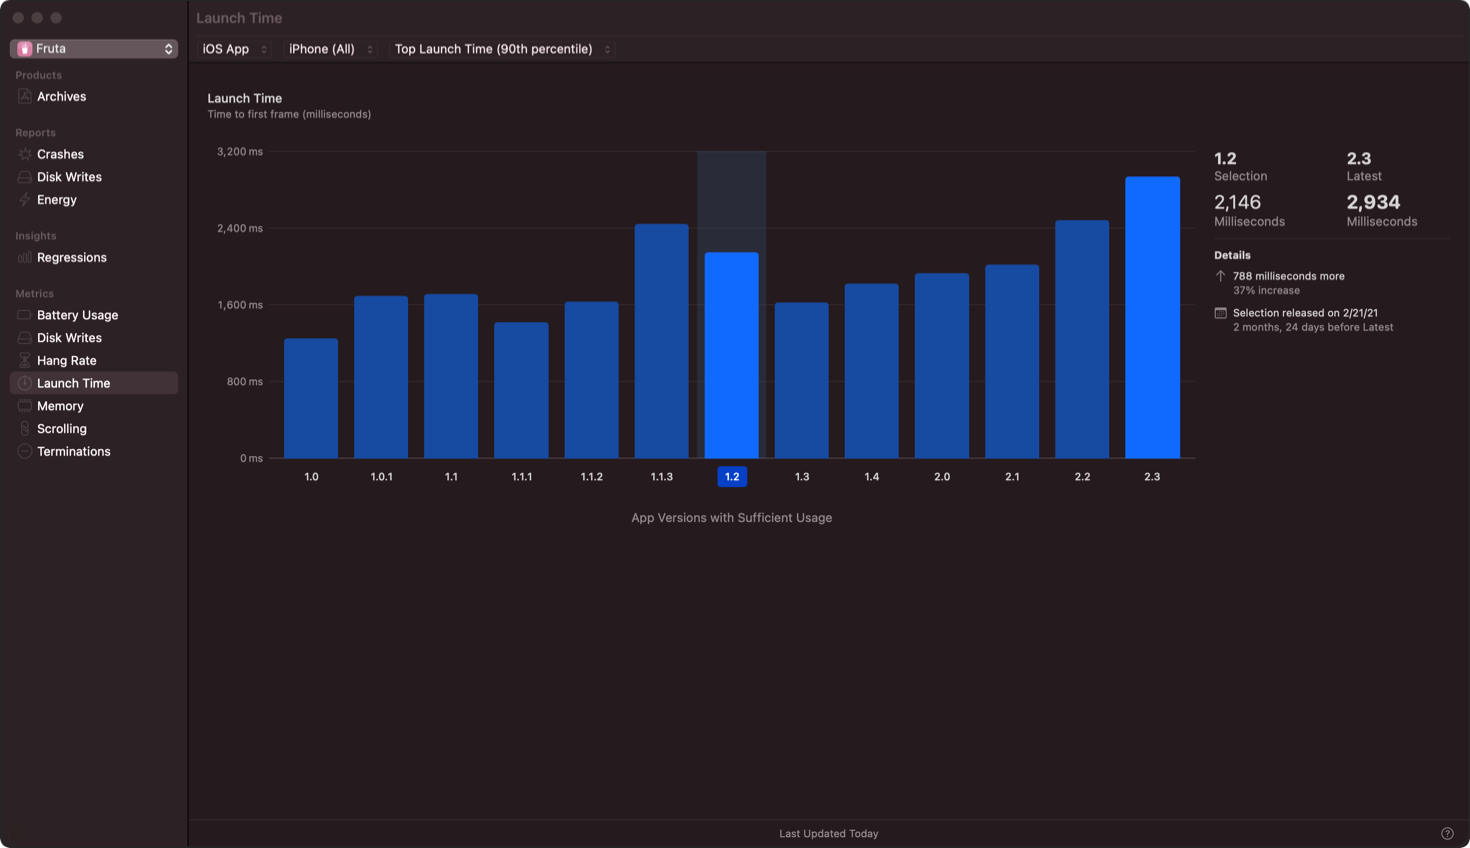
2. Instrumentation:
Use performance testing tools or profiling instruments available for your mobile platform. For Android, tools like Android Profiler or third-party tools like Firebase Performance Monitoring can be used. For iOS, XCode Instruments, specifically the Time Profiler and Activity Monitor instruments, are valuable.
3. Start the Timer:
Launch the app and start the timer simultaneously. Measure the time from the moment you tap the app icon until the app is fully responsive and ready for user interaction.
4. Data Collection:
Gather data for multiple cold start runs to ensure consistency and accuracy. This involves recording the time taken for each launch. You may also want to note device details, OS version, and any other relevant factors that could impact Cold Start times.
5. Analyze Results:
Analyze the collected data to understand the variations in Cold Start times. Pay attention to outliers and identify any potential bottlenecks or issues that contribute to longer launch times.
6. Optimization and Re-testing:
Based on your analysis, consider making optimizations to reduce Cold Start times. These optimizations may include code improvements, resource loading strategies, or caching mechanisms. After implementing changes, re-test the app to see if the optimizations have had the desired effect.
7. Comparison:
Compare Cold Start times across different device models, OS versions, or network conditions to identify any disparities. This can help you ensure that your app’s performance meets the expectations of a diverse user base.
8. Automation:
For regression testing, you can automate the measurement of Cold Start times using scripting or automation tools to ensure that new code changes don’t negatively impact app launch performance.
9. Feedback and Reporting:
Share the results and insights with the development team, so they can work on performance improvements. Provide clear and actionable information on what is affecting Cold Start times.
By measuring and monitoring Cold Start times, you can assess the user experience when launching your app for the first time. This allows you to identify and address performance issues, ensuring that users have a responsive and efficient experience from the moment they open your app.
Swift Load Times and Effortless Responses
Mobile performance testing orchestrates swift load times and effortless responses. It’s not just about delighting users; it’s about embracing them and securing a company’s reputation.
With memory profiling, the art of measuring the cold start, and vigilant attention to performance bugs, mobile performance testers stand as the custodians of flawless user experiences. They ensure users can dive into their mobile apps seamlessly, elevating satisfaction and guaranteeing user loyalty.
Want to build a systematic knowledge in your head?
How to Measure Mobile Performance: Key Metrics
Now that we understand the importance of mobile performance, let’s explore how to measure it effectively. Here are some key metrics and methodologies used in mobile performance testing:
- Load Time: Load time measures how long it takes for an app to open from the moment the user taps its icon. Faster load times are generally preferred.
- Response Time: Response time gauges the app’s responsiveness to user interactions, such as taps, swipes, and inputs. Quick, lag-free responses are ideal.
- Frames Per Second (FPS): FPS measures the smoothness of animations and transitions within an app. Higher FPS values (e.g., 60 FPS) indicate smoother animations.
- Memory Usage: Memory usage metrics help identify memory leaks and inefficient memory consumption. High memory usage can lead to crashes and sluggish performance.
- Battery Consumption: Measuring how much battery an app consumes during use is vital. High battery consumption can lead to negative user feedback.
- Cold Start Time: As mentioned earlier, the cold start time measures how quickly an app launches from a completely closed state. Users expect fast cold start times.
- Network Performance: This metric assesses how well an app interacts with the network. Slow network performance can lead to delays in loading content or data.
Best Practices for Mobile Performance Testing
Effective mobile performance testing relies on a set of best practices to ensure comprehensive and meaningful results. Here are some tips for successful testing:
- Start Early: Begin performance testing in the early stages of development to identify and rectify issues before they become deeply ingrained.
- Real-World Scenarios: Test the app under real-world conditions, including various network speeds, device types, and usage patterns.
- Regression Testing: Perform regular regression testing to ensure that performance improvements don’t introduce new issues.
- Device Diversity: Test on a broad range of devices to ensure that the app performs consistently on different screens, processors, and memory capacities.
- Automated Testing: Implement automated testing wherever possible to maintain consistency and allow for repeated testing.
- Continuous Monitoring: Employ tools for continuous monitoring to catch performance issues in real time and address them swiftly.
- Feedback Loops: Establish feedback loops between testers, developers, and users to address performance issues promptly.
- Iterative Improvement: Mobile performance testing is an ongoing process. Continuously strive to improve the app’s performance based on feedback and data.
Mobile performance testing is not just a luxury—it’s a mission-critical part of ensuring a seamless and delightful user experience. User experience is at the heart of every testing effort. It’s the users who will ultimately determine the success of your mobile app, and their satisfaction is your ultimate goal.
So, get ready to conquer the world of mobile performance testing, and make every app launch a symphony of delight for your users.